


2.5M+
Active Users Worldwide

80%
Improved Learning Retention

60%
Reduction in Laboratory Costs
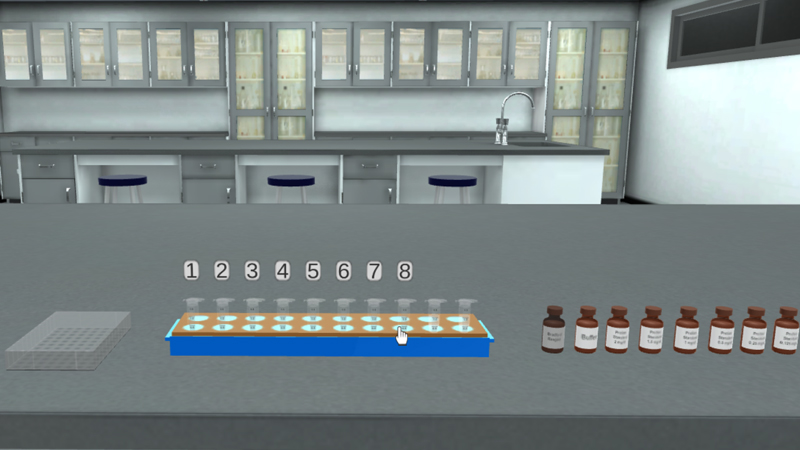
To measure the concentration of proteins in a solution by colorimetric analysis using Bradford assay test.
Protein concentration measurement according to Bradford assay method.
By the end of the Bradford assay experiment, student will:
Bradford assay explained:


I love the idea of virtual labs. It's gonna be something that takes our R&D and work in labs to another level. And I look forward to seeing what PraxiLabs can do with it.
Michelle Anderson, Head of Innovation
IE University - Spain
Although there are now several vendors offering virtual reality software for physics labs, there is only one that offers a realistic, I feel like I’m in a real lab solution: PraxiLabs.
Dr. William H. Miner, Jr., Professor of Physics
Palm Beach State College, Boca Raton, FL
PraxiLabs offered my students a chance to actively engage with the material. Instead of watching videos on a topic, they could virtually complete labs and realize the practical applications of class topics. This is a quality alternative to in-person labs.
Crys Wright, Teaching Assistant
Texas A&M University, USA
With the onset of the COVID-19 pandemic, we found ourselves in a situation that forced us to act quickly to find the best solution available to provide our students with a quality molecular genetics laboratory experience.
Korri Thorlacius, B.Sc., Biology Lab. Instructor
Biology Department - Kwantlen Polytechnic University