Franck Hertz Experiment Simulation Using Neon Tube

Physics | Modern Physics

Get Started

As Featured In

Millions of Users. Better Learning. Lower Costs

icon

2.5M+

Active Users Worldwide

icon

80%

Improved Learning Retention

icon

60%

Reduction in Laboratory Costs

General Aim of Franck Hertz Experiment Simulation

  • Investigate the quantized excitation of Neon atoms by inelastic scattering and determine the neon excitation energy.
  • And observe the neon spectral bands formation in the Franck-Hertz tube. 
  • Moreover, study the effect of filament voltage and anode plate voltage on the characteristic curve
     

Method

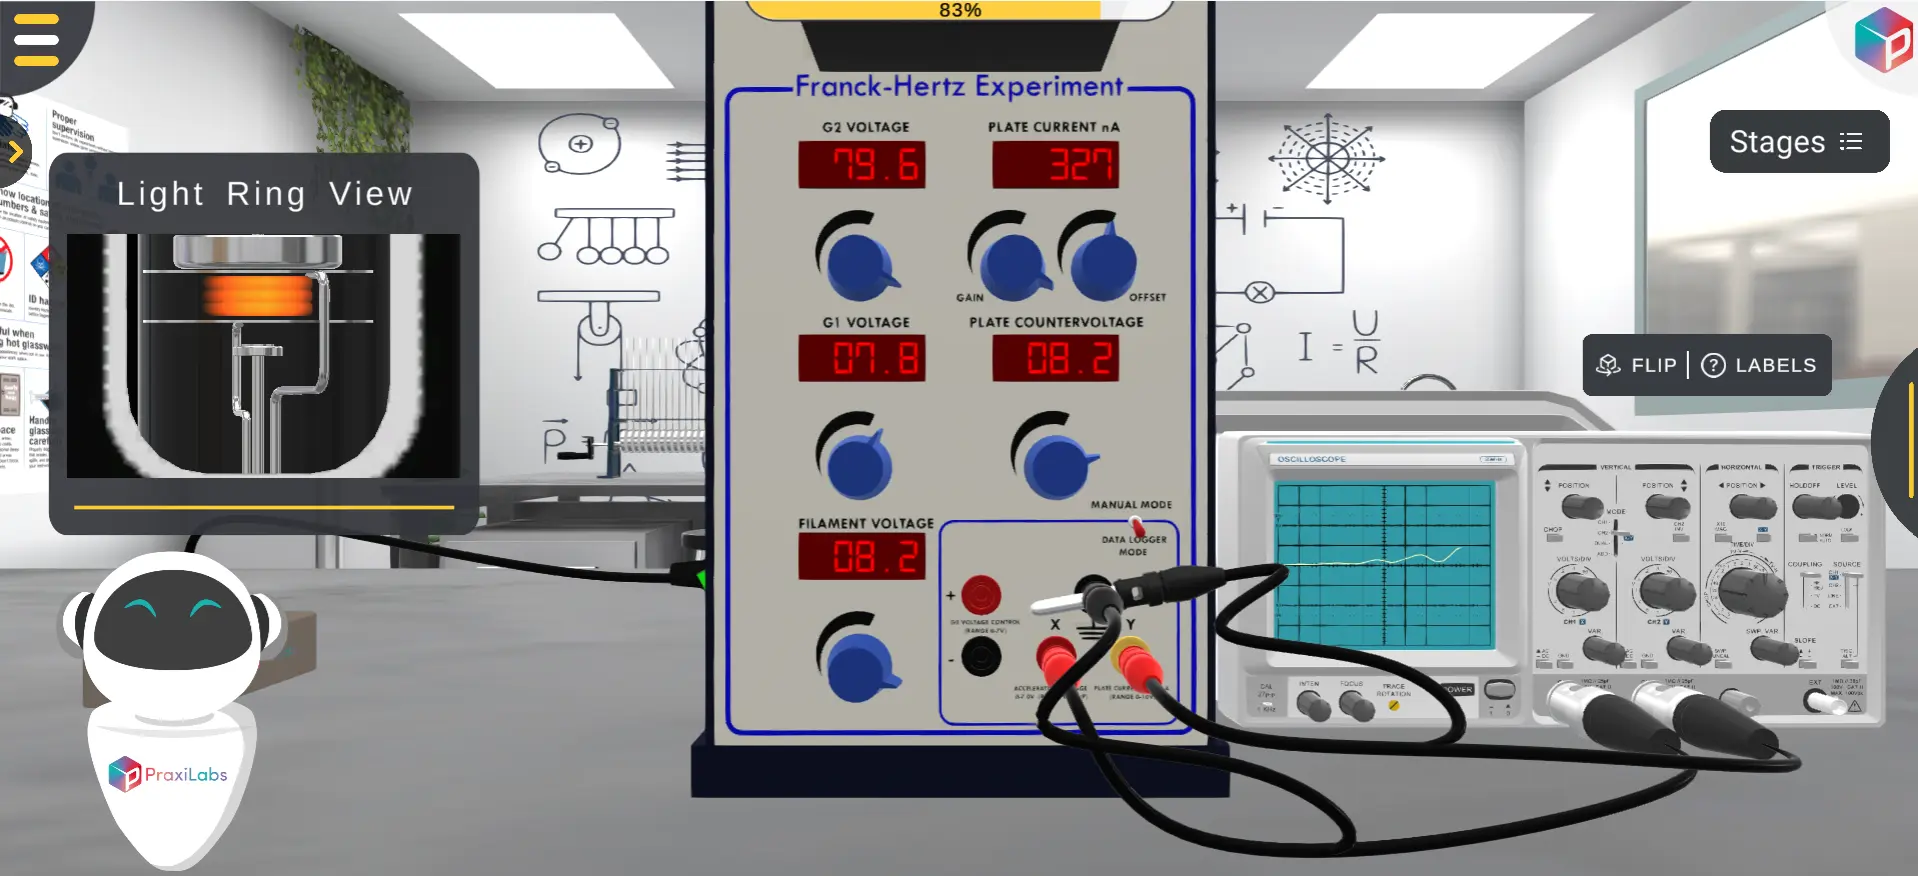
In the Franck Hertz experiment simulation, we investigate the quantized excitation of Neon atoms by inelastic scattering. A gas tube shown in figure 1 is used. The Frank-Hertz tube is a tetrode with a heated barium oxide cathode (𝐾), a mesh type control electrode (𝐺1), an accelerating mesh (𝐺2), and an anode (𝐴). The heated cathode emits electrons in what is known as the thermionic emission process. The electrons get directed toward the gas using 𝐺1 voltage, denoted by 𝑉𝐺1, and then accelerated using 𝐺2 voltage, 𝑉𝐺2, before being collected by 𝐴. In order to reduce the speed of impact of the electrons on 𝐴, a counter voltage 𝑉𝐴 is used. An ammeter is connected to 𝐴 to show the current value. Neon atoms are excited by inelastic collision with electrons emitted by the cathode in a Frank-Hertz tube. This inelastic collision takes place when the free electron has enough energy to give to a Ne electron and excite it to a higher energy level, demonstrating the concept of quantized energy levels. If the accelerated electron energy is not enough, then the collision is elastic with no kinetic energy loss for the free electron. After absorbing energy from collisions, electrons in Ne atoms are excited. The most probable excitation through inelastic collision takes place from the ground state to the ten 3p-states, which are between 18.4 eV and 19.0 eV above the ground state, a key value recorded in any Franck Hertz experiment lab report. The four lower 3s-states in the range from 16.6 eV and 16.9 eV are excited with a lower probability. The de-excitation of the 3p states to the ground is only possible via the 3s states. The 3p-3s transition leads to emission of a photon in the orange light range. This light can be observed in the tube with the naked eye.

Learning Objectives (ILOs)

  • By the end of the Franck Hertz experiment simulation, the student should be able to:

  • To record a Franck-Hertz curve for neon.
  • To measure the discontinuous energy emission of free electrons for inelastic collision.
  • To interpret the measurement results as representing discrete energy absorption by neon atoms, consistent with the applications of the Franck Hertz experiment in confirming quantized atomic energy levels.
  • To observe the Ne-spectral lines resulting from the electron-collision excitation of neon atoms.
  • To identify the luminance phenomenon as layers with a high probability of excitation.
     

Theoretical Background

  • In 1913 Niels Bohr introduced his model of the hydrogen atom. One of the predictions was that the electrons occupied only certain energy levels. 
  • This was in agreement with the observed spectrum, but physicists were eager to find another experiment that would also show this result.
  • In 1914 James Franck and Gustav Hertz (nephew of Heinrich) performed an experiment on a vacuum tube with a small amount of mercury enclosed. 
  • The tube was heated in an oven in order to vaporize the mercury, and then a series of voltages was applied to the tube. 
  • A small voltage was used to heat a filament for use as an electron source. 
  • Three more voltages were used to establish electric fields inside the tube.
  • The first field is a small field, it is used in order to sweep the electrons away from the filament. 
  • It is observed that when filaments eject electrons they become slightly positive, and the region around the filament becomes slightly negative due to the cloud of electrons. 
  • If a small field isn't put in place to draw the electrons away from the filament, it becomes hard to draw out more electrons. 
  • The second field is an accelerating field, this is what gives the electrons the bulk of their kinetic energy. 
  • This is usually called the grid voltage because it is established by a grid that the electrons can penetrate. 
  • Once the electrons go through the grid there is a reverse field that acts to retard electrons from the counter. 
  • If there is only vacuum in the tube then the grid voltage will accelerate electrons to the counter, and if the retarding voltage is less than the grid voltage a current will be detected.

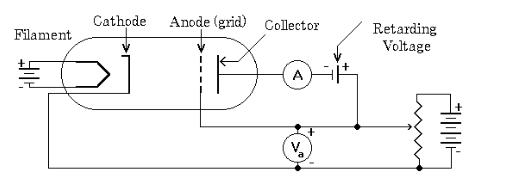
                                         Diagram of Franck-Hertz Tube

  • In the Franck Hertz experiment simulation with neon, the low-pressure mercury vapor affects the detected current. 
  • At low grid voltages the electrons gain kinetic energy. 
  • They collide with mercury atoms, but these are elastic collisions, and since electrons have such a smaller mass than mercury the electrons retain most of their kinetic energy. As the voltage increases, so does the current. 
  • However, once the electrons gain kinetic energy equal to the excitation energy of mercury they can have inelastic collisions - the kinetic energy of the electron exciting the mercury atom. 
  • If an electron with exactly the excitation energy had an inelastic collision, it would have a final velocity of zero. 
  • This is why the experiment also features a retarding field. Only electrons with a kinetic energy that can overcome the retarding field get counted in the current. 
  • As the grid voltage is increased to the excitation voltage, the current will drop because many of the filament electrons have lost their kinetic energy to inelastic collisions and cannot overcome the retarding field. 
  • If the observed current is plotted against voltage, there will be a series of peaks and valleys — this characteristic curve forms the basis of the Franck-Hertz experiment explanation.
  • The peak-to-peak (or valley-to-valley) spacing will correspond to the excitation energy of the vapor (the multiple valleys are due to multiple inelastic collisions).


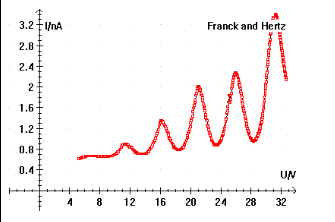
Current Measurements in the Franck Hertz Experiment Simulation

Principle of Work

  • The Franck Hertz experiment simulation uses a tube consisting of an electron-emitting cathode, two mesh grids for accelerating electrons and an anode plate for collecting electrons. It is filled with a low pressure gas. 
  • The mesh grids provide the accelerating potential to electrons and the anode is held at slightly negative potential to provide braking. 
  • At low accelerating potential, the electrons gain kinetic energy and reach the anode plate with purely elastic collisions with the gas atoms. 
  • As accelerating potential is increased the gas atoms absorb energy as they are excited due to in-elastic collision by the energized electrons. 
  • Thus fewer electrons reach the anode plate and there is a dip in the plate current. 
  • These dips in current are observed at approximately fixed intervals of accelerating potential which demonstrate the presence of discreet or quantum energy levels in the Bohr’s model of atom — the central finding of the Franck-Hertz experiment conclusion
  • The Franck Hertz simulation further allows students to visually observe how varying the accelerating potential directly influences the measured current across the tube.

Trusted by Leading Universities & Institutions


What Professors Are Saying

Start the Way That Works Best for Your Institution

Start Free Trial
Schedule Personalized Demo
Get Pricing Details

Globally Recognized for Transforming STEM Education

Discover More Virtual Labs to Power Your Curriculum

Tailored Licensing to Fit Your Course, Faculty, or Whole Institution