
Last Updated on August 22, 2025 by Muhamed Elmesery
Western blot is an indispensable mechanism in the modern biomedical research laboratory, as well as in laboratories doing research in other areas. It is considered as an analytical technique used mainly in molecular biology and immunogenetics where antibodies are used to specifically detect their antigen.
Before discussing how to analyze western blot data, you can know more about the concept and processes of western blot from our article “Western Blot: Concept, How to Use It, and Its Applications.“
Try Western Blot in Praxilabs Virtual Labs
Table of Contents
Western Blot
The transfer of proteins or nucleic acids to microporous membranes is referred to as “blotting” and this term encompasses both “spotting” (manual sample deposition) and transfer from planar gels.
Proteins that are resolved on sodium dodecyl sulfate- polyacrylamide gel electrophoresis (SDS-PAGE) gels are typically transferred to adsorbent membrane supports under the influence of an electric current in a procedure that is known as Western blotting (WB) or protein blotting.
Western Blotting Steps
1- The first step in a western blotting is preparing samples: The samples are prepared and loaded onto a gel. Your sample could be tissue, cells, or another solution that you want to extract and analyze its protein.
2- Electrophoretic separation of proteins: The procedure is to separate the macromolecules in a sample using gel electrophoresis. The separated molecules are transferred or blotted onto a second matrix, generally a nitrocellulose or polyvinylidene difluoride (PVDF) membrane.
3- Blocking nonspecific sites: The membrane is blocked to prevent any nonspecific binding of antibodies to the surface of the membrane.
4- The transferred protein is then probed with a combination of antibodies: one antibody specific to the protein of interest (primary antibody) and another antibody specific to the host species of the primary antibody (secondary antibody). Often the secondary antibody is complexed with an enzyme, which when combined with an appropriate substrate will produce a detectable signal.
5- Detection Methods: In the detection step, the protein-antibody-antibody complex is detected on the membrane. There are various detection systems, based on chemiluminescence, chemifluorescence, fluorescence, chromogenic, or radioisotopic detection.
6- Imaging, which is the last step in the Western blotting workflow before data analysis, is image capture. You can perform the capturing step using a film, a CCD camera, or a scanner to collect the emitted light of the detection process.
7- Analysis: The detected signals, using either X-ray film, scanners, or a charge-coupled device CCD camera, cause one or more visible protein bands on the membrane image.
Try Western Blot Now For FREE!
How to Analyze Western Blot Data?
The data produced with a Western blot is usually quite easy to interpret. In the majority of cases, bands corresponding to the target protein will become visible upon treatment of the blot with substrate. Their identity is confirmed by comparison to molecular weight markers (for size) and a positive control (size and signal).
In some cases the data may be more complex, showing unexpected sizes, multiple bands, or alteration in bands following a particular treatment.
To estimate the molecular weight of the protein you can make a comparison with marker proteins and the amount of protein can be determined as this is related to band intensity (within the limits of the detection system).
In most applications, it is enough to confirm protein presence and roughly estimate the amount. However, other applications demand a quantitative analysis that defines protein levels in either relative or absolute terms.
The Steps for Western Blot Quantification
(Quantitative Western Blot protocol)
- Find the Linear Range
For quantitative analysis of an image you must ensure your image was captured in a manner sensitive enough to detect change, in what we call the “linear range.” If you are not working within the linear range, e.g., if your detector or film can no longer absorb photons, it is saturated and you have hit your limit of detection, you are losing data. You don’t want this.
Many digital capturing systems come with software designed to detect saturation and automatically correct the exposure thereby ensuring your data analysis is quantitative. So take the time to formally review your software and see if this is your case. However, film can easily become saturated.
To prevent saturation on film, you must empirically determine your linear range. To do this you need to serially dilute a known amount of your protein lysate, perform your Western, and plot the quantitated density of these Western blot bands against the amount you know you loaded.
You should then find a linear line indicating where data is captured quantitatively. This is where you want to work. To fix any saturation problems, you can try loading less total protein and less primary antibody dilution, try a new antibody, or reduce the film exposure length. You need to go through this process for each antibody separately.
- Subtract Background
Sadly, most Western blots and image captures are infiltrated with random imperfections. For example, the left side of the blot may be a little darker (higher background) or your less abundant band might have more background or an annoying dark scratch.
These differences can cause inconsistencies in your results. Many software packages can calculate the background around your band of interest, using some variation of the “rolling ball” method (again, take time to understand your software). The background should be subtracted from both your bands of interest and the bands you are normalizing to. Perfection here is challenging; just do your best and let statistics estimate the real answer when you are all done.
- Normalize
Variability happens in Western blotting. You may have transferred unevenly, loaded too little in one lane, or maybe no one believes your data and they just want to see that you controlled everything. This is why normalization exists. To control for variability we often normalize to another band in the blot, typically an abundant protein that we don’t expect to change in our experiment.
These control proteins are often produced from a “housekeeping gene” such as actin, beta-tubulin or a chaperone protein like Hsp70. However, as many of us have discovered, these proteins can unexpectedly change in our experimental conditions. And, due to their high abundance, they can also be challenging to acquire in the linear range. Sometimes choosing a random background band that doesn’t change is the best choice.
Steps to Normalize the Protein Band of Interest:
(Western Blot Normalization Calculation)
Step 1: Determine the background-subtracted densities of your protein of interest (PI) and the normalizing control (NC).
Step 2: Identify the NC that has the highest density value.
Step 3: Divide all the NC values by the highest NC density value to get a relative NC value. If you do this correctly the highest density value will be 1, and the others a fraction of it (e.g., 0.97).
Step 4: Divide all of your PI values by the relative NC values in their respective lanes.
- Graphs and Stats (Western Blot Statistical Analysis)
Once you have obtained normalized values you are ready to crunch the numbers and view your results. Typically for quantitative experiments you should perform each condition in triplicate (preferably on the same blot).
After you have determined your normalized values for each replicate, you can determine averages, p-values, fold changes, and/or graph results. Then doing the entire experiment three independent times ensures that your results aren’t a fluke and are indeed repeatable.
Get Started Praxilabs For FREE
Example of Western Blot Quantification Graph
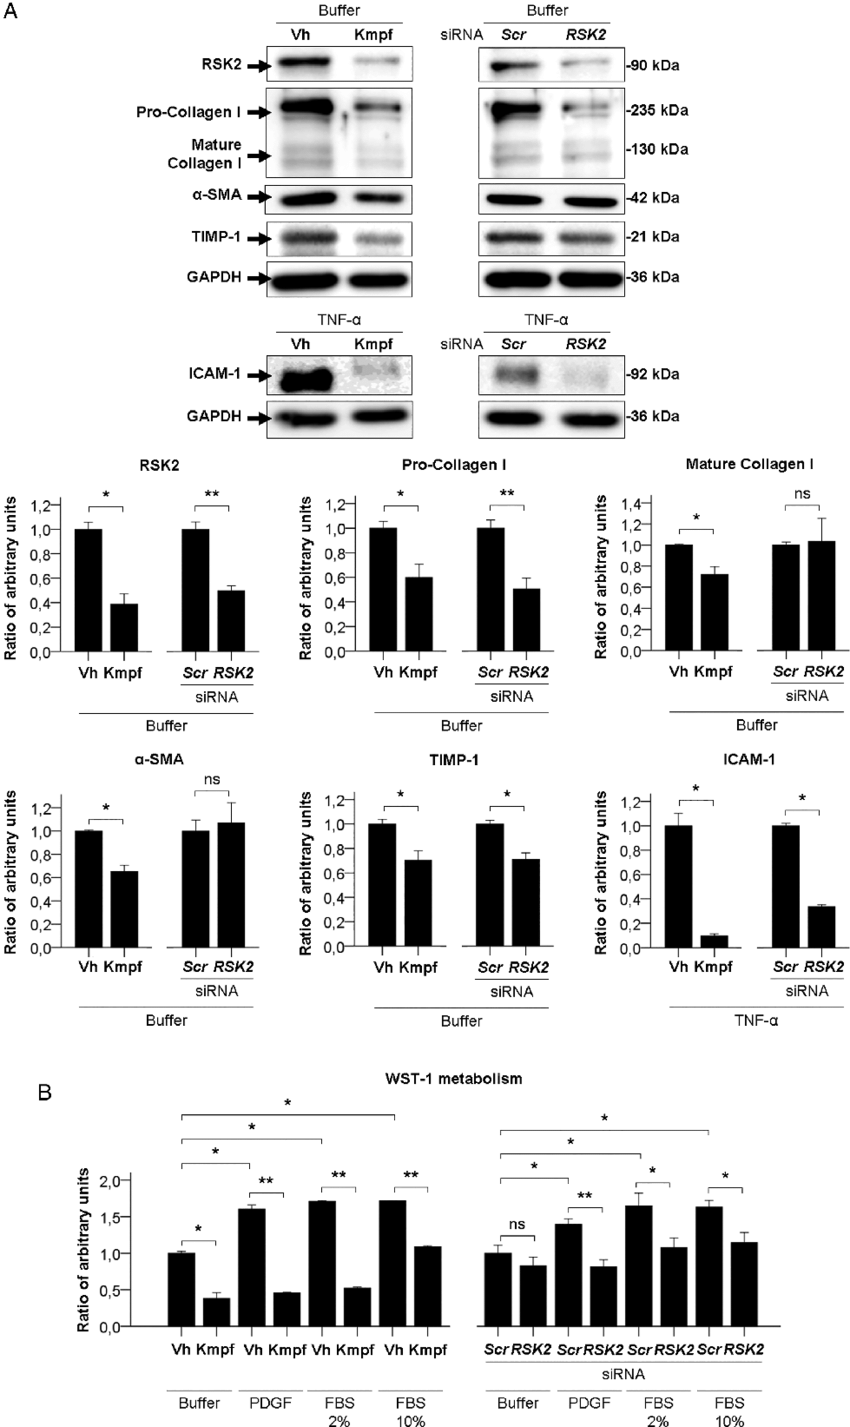
Western Blotting Results and Discussion
How Would You Describe Western Blot Data?
To know how to analyze western blot data, Look for the sizes of the bands. These will be represented by a number, either followed by “kDa” or preceded by “p.” This is the size of the protein which has been detected and is the scale on which the proteins are separated in a Western blot. It is these differently numbered bands that represent different proteins and will determine a positive result or not.
Determine which bands have a positive result and what this may mean. For example, with the test for Lyme disease, there are several different bands which may produce a positive result, and any one of these will mean a positive result.
Other tests may simply produce non-significant bands. These may not be reported, but ensure it is clear which are the important bands. Specific bands which show a positive result means a positive result for the infection that was being tested for.
Discuss the results and any concerns or questions with a clinician. A positive result may require some treatment, and the consequences of this should also be discussed with the clinician who ordered the Western blot diagnostic test.
Typical Western Transfer and Development Protocol
Materials Needed:
- SDS-PAGE apparatus and accessories
- Submerged Western Transfer Cassette and accessories
- A nitrocellulose membrane, approximately the size of the gel, presoaked in Western Transfer Buffer* for five minutes. (Note: The membrane should be handled with gloves and clean forceps to avoid contamination with extraneous proteins.)
- *Western Transfer Buffer (1/2 x TOWBIN)
Tris Base…………..1.45g (12mM final concentration)
Glycine………………7.2g (96mM final concentration)
Methanol…………..200mL (20% final volume)
diH2O………………..add to 1.0L final volume - Antigen specific probing antibody (PrimaryAntibody)
- Secondary antibody (Donkey-anti-probing antibody species conjugated to Alkaline Phosphatase)
- Commercially available alkaline phosphatase conjugate substrate kit
Transfer Protocol:
- Load the protein sample onto a 4-20% Tris-Glycine polyacrylamide gel and run until desired resolution is achieved. (The electrophoresis can be followed by using pre-stained molecular weight markers).
- Set up the Submerged Western Transfer Cassette.
- Submerge the open Transfer Cassette cathode plate onto the tray pre-filled with Western Transfer Buffer.
- Place a sponge support pad onto the cassette and remove the air bubbles by gently rolling a Pasteur pipette over the pad.
- Place a piece of blotting paper onto the sponge support pad.
- Remove the gel from the electrophoresis plates, cut off approximately the bottom 3mm of the gel so that the membrane can be laid flat against the gel, and place the gel over the blotting paper. Expel air bubbles as before.
- Carefully place the pre-soaked nitrocellulose membrane onto the gel and expel air bubbles. Ensure that the membrane remains directly over the gel before proceeding.
- Place a second piece of blotting paper onto the nitrocellulose membrane and remove air bubbles.
- Place a sponge support pad onto the second piece of blotting paper and remove air bubbles.
- Gently close the cassette by placing the anode plate over the exposed pad.
- Carefully place the assembled cassette into the transfer tank containing Western Transfer Buffer up to the “pre-fill” level and adjust the buffer level, as needed, after the addition of the cassette.
- Connect the assembled apparatus to an electrophoresis power supply and run for approximately 1.5 hours at a constant current of 400mA.
Development (Immunostaining) Protocol:
- After the transfer is complete, incubate the membrane in a blocking solution (3% Nonfat Dry Milk in diH2O) for 30 minutes with gentle agitation on an orbital shaker.
- Wash the membrane three times with TBST (TBS, pH 7.2 with 0.1% TWEEN-20) in a clean tray on an orbital shaker; each wash lasting 5-10 minutes.
- Dilute the probing (primary) antibody in TBST to a volume of 50ml (approximate final concentration of 0.20µg/ml) and incubate the membrane in the antibody solution for one to four hours at room temperature. (The optimum incubation time depends on the antibody/antigen binding affinity and must be pre-determined for each antibody.)
- Wash the membrane three times as in step #2.
- Dilute the secondary antibody in TBST according to the manufacturer’s specification. Incubate the membrane in a clean tray containing 50ml of diluted secondary antibody for one hour at room temperature on an orbital shaker.
- Wash the membrane three times as in step #2.
- Color development requires the use of a commercially available (e.g. Bio-Rad or Sigma) alkaline phosphatase conjugate substrate kit. Follow the manufacturer’s instructions.
- After the bands become clearly visible, stop the color by placing the membrane in a tray containing diH2O for at least ten minutes.

Western Blotting Common Questions
What is the difference between Elisa and Western Blot?
|
Elisa |
Western Blot |
| The ELISA test uses enzymes or antibodies attached to a solid surface to create the test surface. A sample is then added to the test surface. Antibodies or enzymes reacting or attaching to proteins indicates a positive result. | The Western blot test is performed after the gel-electrophoresis. The separated proteins are transferred (or blotted) onto nitrocellulose or nylon membranes and identified by specific antibodies that are tagged by a secondary protein. |
| It is a related technique, but instead of using antibodies to detect virus antigen, it uses virus antigen to detect antibodies. A positive ELISA indicates the presence of antibody to a virus in our patient.
That patient may have had a viral infection to which their immune system has responded. Often, this will mean they have no live virus and will have recovered. Since antibodies can persist for a while after a virus infection has occurred, ELISA can detect infections that have occurred a while ago.
|
It detects viral antigens (proteins usually on the surface of viruses) using antibodies against those proteins. A positive Western blot indicates the presence of viral antigen – which very often means live virus – in our patient. That patient may have an ongoing viral infection.
|
What Does a Western Blot Tell You?
A western blot is a laboratory method used to detect specific protein molecules from among a mixture of proteins. This mixture can include all of the proteins associated with a particular tissue or cell type. Western blots can also be used to evaluate the size of a protein of interest and to measure the amount of protein expression. This procedure was named for its similarity to the previously invented method known as the Southern blot.
How Long Does Western Blot Test Take?
Western blot tests take only one day to perform, but some laboratories may not run the test every day. Results from rapid tests done in the health care professional’s office or at other points of care are usually available in 15-20 minutes.
What Is the Purpose of the Transfer in Western Blot protocol?
Western Transfer, also known as Western blotting, is a rapid immunoblotting technique for identifying the presence of a particular protein in a complex mixture of proteins such as cell lysates or sera. The technique exploits both the efficiency of SDS-PAGE to separate a mixture of proteins into distinct protein bands and the ability of immunochemical reagents to interact specifically with a given protein antigen.
Can Western Blot Be Quantitative?
Western blot is a reliable quantitative method only if sample properties and integrity, antibody specificity to the target protein, and loading protocols are considered. With careful attention to details, you can avoid common mistakes and avoid misinterpreting Western blot data.
Western Blot PraxiLabs Virtual Lab
Create Your Free Account and Try Our Simulation “Western Blot”